
The Stock Exchange Is Rigged for The Super Rich - Click The Video
THINK ABOUT THIS
These transactions they happen in less than a millionth of a Second.
You and I are not that fast. The principle of working hard is a thing of the past.
Change the word
WORK to TRANSFORM
You want to go to work compete with Ai. So you can make an income.
WHY not just use Ai to Design a Life
That is so much simpler
An Original Discovery (1960s)
In 1959, scientists at Corning were experimenting with chemically strengthened glass. During one experiment, a glass sample was accidentally heated to a much higher temperature than intended. When a technician attempted to discard it, the glass bounced instead of shattering.
However, the market was not ready for this new glass, and the technology remained largely dormant for decades.Forty years later the
Smartphone Revolution
In 2006, Steve Jobs was preparing the first Apple iPhone. Early prototypes used plastic screens, but Jobs reportedly became frustrated when scratches appeared after carrying a prototype in his pocket by his keys. Apple needed a stronger transparent material quickly.
Jobs contacted Corning and asked whether the company could produce a modern version of its old chemically strengthened glass technology. Corning revived and improved the Chemcor process and created what became known as Gorilla Glass. The first iPhone launched in 2007 with Gorilla Glass covering the display, helped to establish a new industry standard.
Add a Title Here
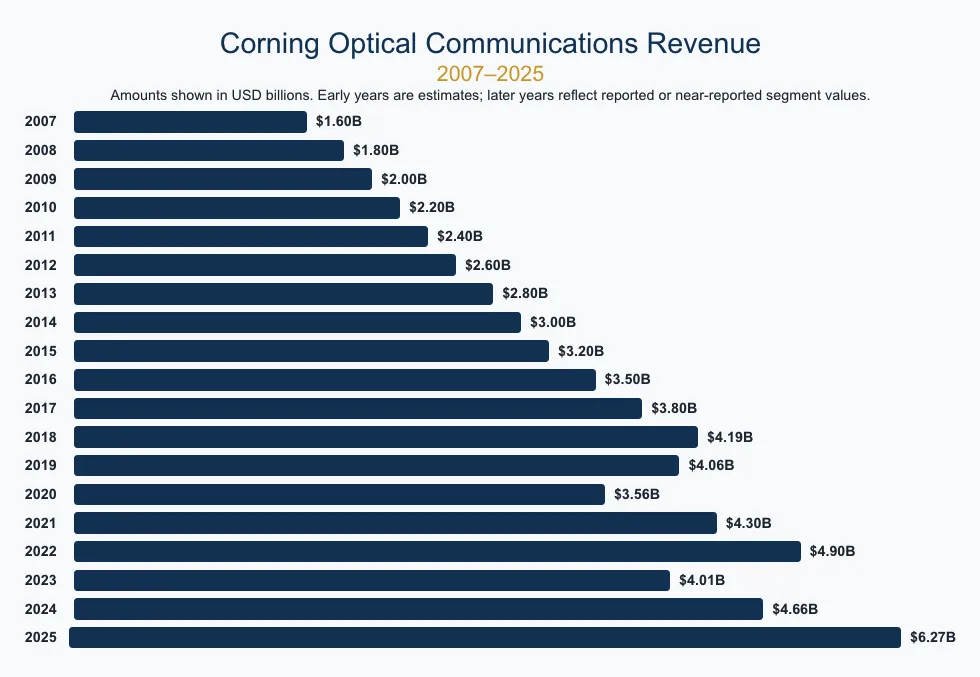
Corning Optical Communications Revenue
2007–2025
Amounts shown in USD billions. Early years are estimates; later years reflect reported or near-reported segment values.
1960–1985
Illustrative Chemcor (Pre-Gorilla Glass) Annual Sales
Illustrative estimates only. These are not confirmed Corning historical sales figures.
Add a Title Here

California Regional GDP Analysis 2014–2024
| Regional Economic Zones | Current GDP (2024) |
Baseline GDP (2014) |
Growth Rate |
Economic Ranking |
|---|---|---|---|---|
| Southern California Region | $1.50 T | $0.91 T | 65% | #1 |
| Bay Area Region | $999.5 B | $572.0 B | 75% | #2 |
| San Diego Region | $261.7 B | $154.0 B | 70% | #3 |
| San Joaquin Valley | $192.4 B | $112.0 B | 72% | #4 |
| Sacramento Region | $177.5 B | $115.0 B | 54% | #5 |
| Central Coast | $134.2 B | $85.0 B | 58% | #6 |
| Northern California | $42.0 B | $27.0 B | 56% | #7 |
| Mountain/Rural | $13.4 B | $8.5 B | 58% | #8 |
| State Totals | $3.20 Trillion | $1.86 Trillion | 72% Avg | 8 Regions |